You export two months of transactions from your checking account, and it works. Column A is the date, column B is the description, column C is a negative number when money leaves. You build a pivot table, you feel briefly competent.
Then you export the joint account from the second bank. Column A is a date, but written 03/07/2025 instead of 2025-07-03. There is no amount column — there is a Debit column and a Credit column, both positive, one of them always blank. There are four rows of account-holder details above the header. Your formula returns #VALUE! on every line, and the pivot table now thinks you spent nothing all quarter.
Nothing is broken. The two files are just describing the same thing in two different shapes.
Why do my bank CSV files have different columns?
There is no standard for a bank statement CSV. There are standards for other things — OFX is a defined format, and so is the fixed-layout data banks exchange between each other — but the CSV download is a convenience export, generated by whatever core banking platform the bank runs, styled by whatever team owned the online banking rewrite that year.
That leaves each bank free to make a handful of independent decisions, and the combinations multiply fast.
How the amount is expressed. Two schools. Signed amount: one column, -42.60 for a purchase, 1,800.00 for a deposit. Or split columns: Debit and Credit, both positive numbers, with the sign implied by which column is populated. A third variation writes outflows in parentheses — (42.60) — which spreadsheets read as text unless coaxed.
How the date is written. 03/07/2025 is the 3rd of July in most of the world and the 7th of March in the United States, and the file rarely says which. Some exports go further and split the date into separate Day, Month and Year columns, or give you two dates — transaction date and posted date — with no indication of which one your spreadsheet should sort on.
How the description is packed. One bank gives you a clean merchant name. Another concatenates merchant, city, card last-four, terminal ID and reference number into a single 90-character string. A third splits the same information across Description, Memo and Reference, and puts the useful part in whichever one it feels like that day.
What else rides along. Running balance columns, currency columns, transaction type codes, cheque numbers, category labels the bank guessed at. Useful sometimes. Not present consistently.
What surrounds the data. Preamble rows with the account number and statement period. A blank row between the header and the first transaction. A totals row at the bottom that looks like a transaction and is not. Semicolons instead of commas as the delimiter, which is normal across much of Europe because the comma is already the decimal separator. Encoding that mangles accented merchant names.
Every one of those is a defensible local decision. Together they mean two files from two banks, describing identical activity, share almost no structure.
Why one formula never survives two accounts
The spreadsheet approach fails in a specific way, and it is worth naming because it explains the wasted afternoons.
A formula encodes assumptions about position. =SUM(C2:C500) assumes the amount is in C and starts on row 2. The moment the second file has its amount in D and E and starts on row 6, you are not adjusting a formula — you are rewriting a small program, and you will rewrite it again next month when the bank adds a column.
So people normalise by hand. Delete the preamble rows. Insert a column. Write =IF(D2>0, -D2, E2) to collapse debit and credit into one signed number. Reformat the dates, discover half of them silently transposed day and month, fix those. Strip the totals row. Then repeat, from memory, in four weeks.
The cost is not the effort. It is that a manual step done monthly gets skipped, and a merged view that is two months stale answers nothing. This is the point at which most people quietly stop tracking, which is the same reason expense trackers get abandoned at the setup step rather than at the using step.
It gets worse with more accounts. A household running five to eight accounts across two banks and two cards is merging five to eight incompatible layouts, before anyone has agreed who is doing it.
Merging CSV files with different formats without mapping columns
The alternative to normalising by hand is to have the file read as it is.
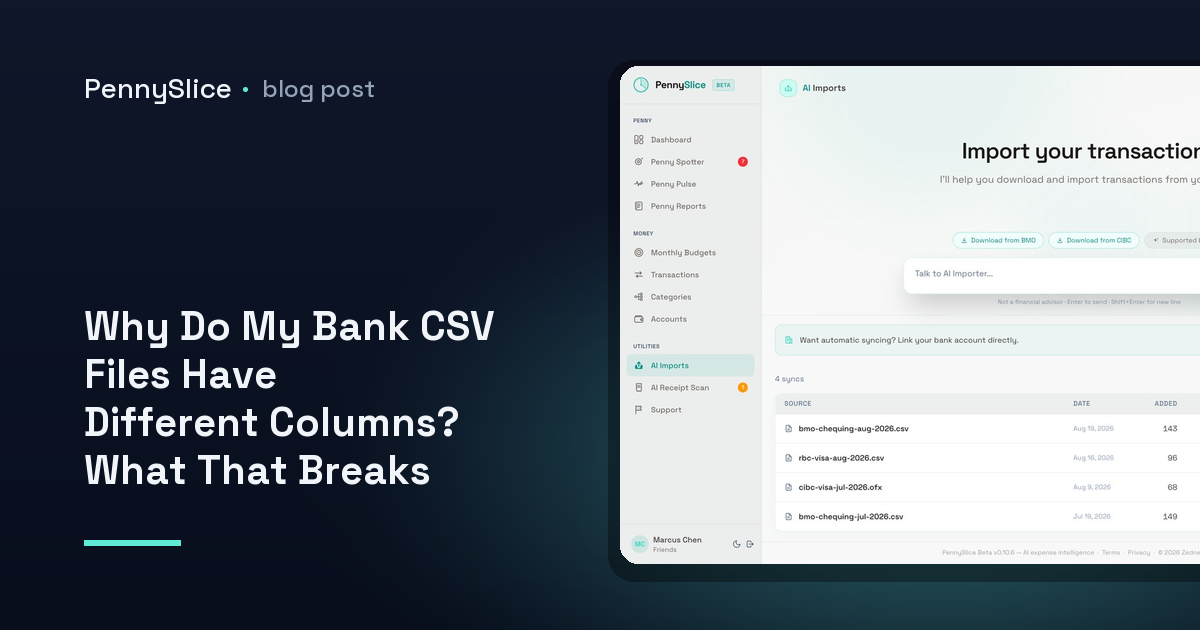
PennySlice detects structure on import. Drop the file in and the AI reads it — finds where the real header row is, works out which column holds the amount, recognises a debit/credit pair and collapses it, infers the date format from the spread of values across the whole file rather than guessing from the first row, and identifies the description field even when it is three fields glued together.
There is no template to pick and no column-mapping screen. You do not tell it that column D is the debit column. That matters more than it sounds, because column-mapping is exactly the step where setup stalls: it asks you to understand your bank’s export conventions before you are allowed to see a single number.
Mix layouts freely. Two banks with opposite amount conventions land in the same dataset, correctly signed. The formats accepted are CSV, Excel, OFX, PDF, email forwarding and a photo of a receipt — so an account that only offers a PDF statement is not excluded from the merged view.
Once the transactions are in one place, they are categorized automatically, including at the line-item level within a single purchase — a Costco trip split across groceries, clothing and household rather than dumped into one bucket.
What you get on the other side of the merge
A merged dataset is the precondition for every question worth asking. Spending by category across all accounts, not per account. A recurring charge spotted on the card and the checking account as one subscription rather than two coincidences. A question typed in plain English — “what did we spend on groceries in Q2” — answered with a figure drawn from every file you imported, not the one that happened to open cleanly.
Penny Spotter runs seven background detectors across that combined data: budget pace, category anomalies, recurring cost creep, predicted expenses, savings opportunities, income changes and merchant concentration. None of them work well on one account in isolation, because spending is not organised by account.
Import requires no standing connection to anything — the file is the whole handshake. If you would rather have transactions arrive on their own, bank linking is available on paid tiers in the US and Canada through Plaid, where your login is entered at your bank and what comes back is a revocable read-only token. You can mix both.
Export last month from your two most awkward accounts and drop both files in as they are. If they land as one clean list, you never have to write the reconciliation formula again.
PennySlice provides spending information, not financial advice.